We have developed a new technique for the rapid measurement of the degenerate nonlinear absorption spectrum and the dispersion of the nonlinear refraction. We refer to this method as a white-light continuum (WLC) Z-scan [1]. In this method, a high energy, broadband femtosecond WLC generated from loosely focusing into a hollow chamber filled with pressurized noble gas is used to replace the single wavelength source (OPG/OPA) conventionally used in Z-scan experiments [2].
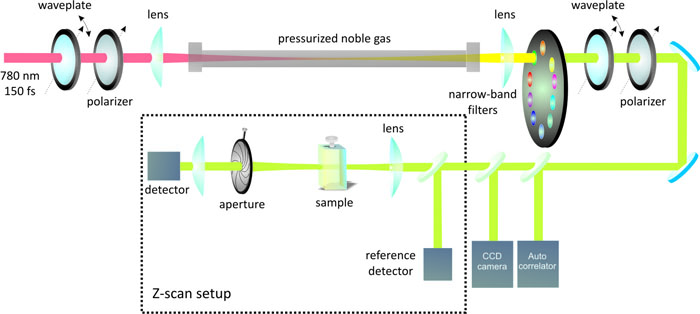
To distinguish the degenerate nonlinear response from the non-degenerate nonlinear contribution, we spectrally separate the WLC wavelengths by using narrow band pass interference filters (NBFs). These NBFs are placed on a computer controlled motorized filter wheel.
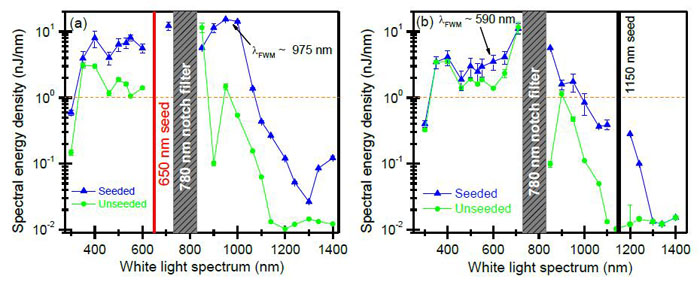
Recently, we have shown that a weak seed pulse (1 µJ compared to a 400 µJ, 775 nm pump pulse) can enhance the white light spectrum by nearly 4 times [3]. This enhanced spectrum extends our wavelength range from below 400nm to greater than 1000nm using the WLC as a pump source. For more info, see Ref. [3] and/or conference proceedings for T.R. Ensley et al. Conference on Lasers and Electro-Optics (2011).
[1] M. Balu et al. Journal of Optical Society of America B 25, 159-165 (2008).
[2] M. Sheik-Bahae et al. IEEE Journal of Quantum Electronics 26, 760-769 (1990).
[3] T.R. Ensley et al. Optics Express 19, 757-763 (2011).
Our group is investigating the field enhancing potential of various nanostructures, from spherical and rod-shaped particles to more complex geometries in a number of different host materials for enhanced all-optical switching and optical limiting applications.
Noble metal nanostructures have been the subject of intensive research due to their inherent field enhancing capabilities in the spectral vicinity of plasmonic resonances. These resonances arise naturally from the geometrical confinement of large densities of radiatively excitable free electrons, inducing large electric fields and strong field gradients which can be exploited for numerous applications. These include Surface Enhanced Raman Scattering (SERS) as the most prominent candidate, fluorescence enhancement from molecules, and enhanced generation of higher harmonics. Following this trend, there is great interest in enhancing third order nonlinearities such as two-photon absorption (2PA) and Kerr-like nonlinear refraction (NLR) for enhanced all-optical switching and optical limiting applications.
Enhanced Nonlinearities
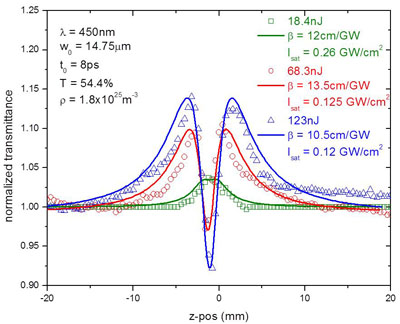
When suspended in host materials which possess a pronounced nonlinear optical response, the field enhancing character of the nanostructures will act as an amplifier for the intrinsic nonlinear response when both are resonantly excited. For instance, the plasmon resonance of silver nanospheres at 450nm spectrally overlaps the 2PA band of carbon disulfide (CS2) between 350nm and 500nm, yielding a significant increase in the 2PA cross section relative to the value of pure CS2.
More complex systems involve organic molecules being chemically attached to metal nanostructures, thus facilitating the enhancement by placing the active material into hot spots of the electric field distribution. Other samples involve the deposition of 2PA’ing materials (dyes, semiconductors, quantum dots) onto e-beam lithographically written samples.
Transient Behavior
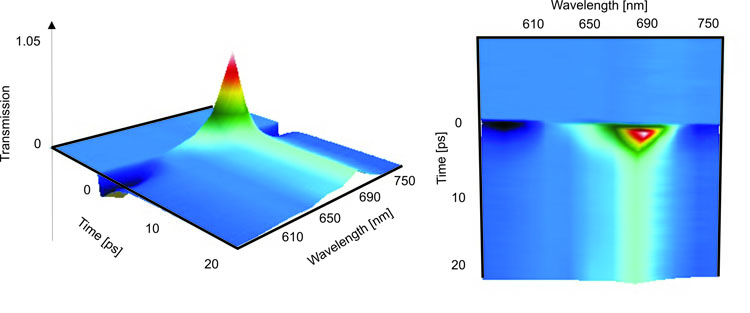
Under strong irradiation plasmonic structures tend to exhibit a saturable absorption behavior, which is caused by an increase in the electron-electron scattering and a subsequent broadening of the plasmonic resonance. Using pump and probe techniques we are able to monitor this transient change in absorption with resolutions of down to fractions of a picosecond. On longer time scales various acoustic modes, so called breathing modes, are observable.
An interesting phenomenon of photochromic materials is that they can be reversibly transformed from a colorless form to a colored form by exciting with UV light. To widely apply this transformation property to optical limiting or optical switching, we attempt to achieve the transformation with visible light or even IR. One method is to make use of a nonlinear effect such as two photon absorption (2PA). But photochromic molecules usually don’t have large 2PA cross section. So we try to make the transition through mixing them with 2PA dyes which transfer the energy from the 2PA dyes to photochromic molecules through fluorescence (FRET).
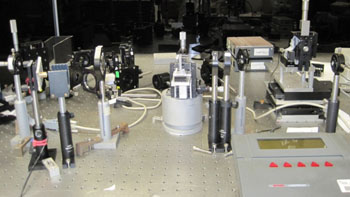
Measurement of the transformation of a photochromic molecule with a UV laser diode and Ocean Optics spectrometer
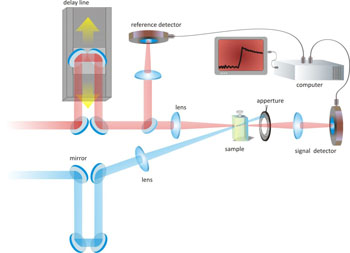
Pump-probe set up for the transformation dynamics of a photochromic molecule.
This work is in collaboration with Soreq NRC in Israel, Interdisciplinary Center of Nonoscience CINaM in France, and the Department of Chemistry in Ben-Gurion University of Negev in Israel. Our work includes the characterization of photochromic materials, 2PA dyes, Forster Energy Transfer (FRET) measurements, and modeling the transformation and limiting processes.
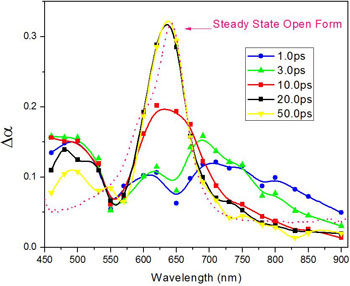
Fast dynamics of SPO1 transformed from colorless form (closed form) to colored form (open form)
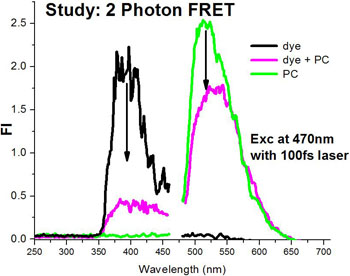
Demonstration of Forster Energy Transfer (FRET) from a 2PA dye to a photochromic molecule (PC)
Software Tool for Modeling of Laser Pulse Propagation Through Bulk Nonlinear Media
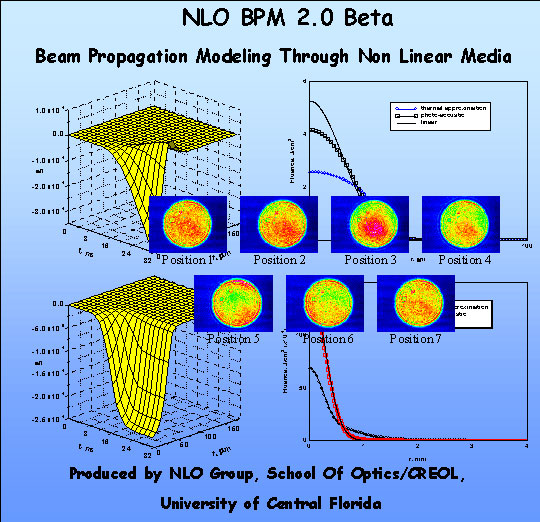 Download here
Main Features
This software tool consists of a set of codes as well as a graphical user interface (GUI) used for simulation of high-energy laser pulse propagation through an optical system that contains one nonlinear optical element. Figure 1 shows the typical layout of such a system. The GUI was developed for a Windows 95/NT operating system although the codes can be run without GUI under DOS and UNIX as well. The program also allows modeling of free-space propagation and Gaussian beam (ABCD) propagation. A description of some of the characterization techniques and theoretical understanding of the modeled nonlinearities is presented in Refs. [1-3,7]. The computational methods are reviewed in Refs. [8-9]. The spatial shape of the input beam can be chosen to be either Gaussian or top hat (Super-Gaussian of high order). The temporal shape of the beam is considered to be Gaussian. The types of nonlinearities included are instantaneous (Kerr-like refractive index change, n2, and two-photon absorption, 2PA - b) and cumulative (excited states absorption and refraction and thermal refraction). Thermal nonlinearities are described in Ref. [7] and can include the transient acoustic wave generated by absorption.
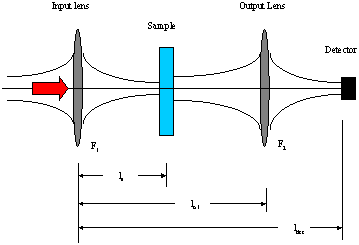
Figure 1: Typical experimental layout for the nonlinear propagation calculation. All distances are measured from the input lens. ls is the distance to the sample, lo.l. the distance to the second lens and ldet is the distance to the detector. If lo.l is set equal to zero, the second lens is removed.
Working with the GUI
The set of input parameters used by the program is stored in two separate log files. One file contains the information about the system parameters (the geometry of the optical system as well as the input beam parameters) while the second one contains the parameters of the nonlinear sample. The files are ASCII text files and designed to be in a specific format (the list of the variables names, values and brief descriptions of their meaning are included). Log files can be edited by the user. In order to do this one has to open them in any Editor (Notepad, Wordpad etc.) and change the values of the variables only. They can also be changed through the GUI.
The program can also provide a set of output files (ASCII files) for later reviewing with some plotting software.
Mode
Mode must be defined before the running the program. There are five options:
- Single – single propagation through the system (default)
- Linear – free-space propagation through the system (nonlinear properties of the sample are ignored)
- ABCD – Gaussian propagation (analytical using ABCD method)
- Z-scan – multiple propagation for different input positions of the sample (model of the typical Z-scan experiment)
- Limiting – multiple propagation for different values of input energy (model of the typical limiting experiment)
Options
Run-time Plots
- The information on field distribution as well as nonlinear susceptibility distribution inside the sample can be viewed in real time (but this can slow down the program).
- Population density of the first (second) level is used only for excited state nonlinearity. For nanosecond pulses it is the density of levels S1 and T0 (see Figure 2). For picosecond pulses – density of the levels S0 and S1 is displayed.
- Index change is used only for a thermal nonlinearity and represents the refractive index change due to the thermal effect.
- Temperature change is used only for a thermal nonlinearity.
- Fluence change can be used either with excited states or thermal nonlinearities.
- Irradiance and Phase – show the irradiance and phase (wrapped) distribution inside the sample for each time slice of the pulse.
- Absorption and Refraction – show the overall absorption and refractive index change inside the medium for the current pulse slice.
Input Parameters
System Parameters:
Geometry of the system (if distance to the output lens is set to be zero – the output is viewed without the second lens) and the input beam parameters (no input phase information so far)
Sample Parameters:
Thickness of the sample as well as linear and nonlinear susceptibility, and cross sections for excited state absorption and refraction. If excited state nonlinearity is chosen, the level structure defining the parameters is given in Fig. 2.
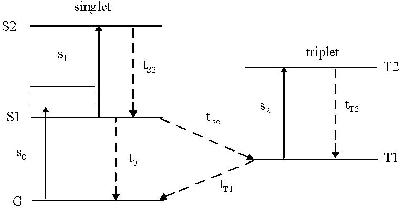
Figure 2 Five-level system for excited state absorption calculations
Input From File – if the desired sample log file already exists simply type its path in the provided dialog (it can also be viewed before pressing the Enter button).
Input From Dialog – if the desired sample log file does not exist the user can define the values of all the sample parameters manually by typing them in the dialog provided. The desired nonlinearity has to be chosen first and then after pressing the View button one can type all the values for the constants stored in log files.
Advanced Parameters:
Information about the propagation step sizes range, size of the data window BPM algorithm etc. (for advanced users only)
Output Parameters
Output Files Parameters:
There are two types of output files 1D (for the one dimensional data – y(x) ) and 2D (two dimensional data – matrix z(x,y)).
- Output Files Path – select the directory to put the output files (by default the working directory is chosen).
- Field Distribution – output files will be produced for the field distribution at each plane of the system as well as inside the sample).
- Nonlinear Parameters – output files will be produced for the absorption, refraction, etc. inside the sample.
If modeling the Z-scan (Z-scan) or limiting (Limiting) experiments a few additional 1D files will be created.
Warning
The program you are about to use is still in the stage of developing and testing. It contains bugs that might affect the normal operation of your computer system. It is recommended to try this program under Windows NT 4.0, since it has a way to kill the process if it "hangs" and is generally quite stable. GUI part of the program is being constantly tested and updated, so any bug report (or just advice) would be highly appreciated. The numerical part of the program is not protected from the "wrong" data input and therefore might cause an unexpected exception or error message to show or operating system to "hang". In this case try to exit the program using the buttons Stop and Exit and in case of failure – kill the process. The more stable and complete version of this program is expected to be available by summer (SPIE Annual Meeting in San Diego when it will be presented).
References
- "Application of Nonlinear Optics to Passive Optical Limiting", E. W. Van Stryland, D. J. Hagan, T. Xia, and A. Said, pp 841-860, in Nonlinear Optics of Organic Molecular and Polymeric Materials, ed. H. S. Nalwa and S. Miyata, CRC Press Boca Raton (1997).
- "Characterization and Modeling of Nonlinear Optical Absorption and Refraction", E. W. Van Stryland, M. Sheik-Bahae and D. J. Hagan, in Nonlinear and Quantum Optics, ed. N. Bloembergen, pp. 527-578, Research Trends in Physics Series, Institute for Advanced Studies Press, 1997.
- "Introduction to Ultrafast and Cumulative Nonlinear Absorption and Refraction", E. W. Van Stryland, in Beam shaping and control with nonlinear optics, Eds. F. Kajzar and R. Reinisch, Plenum, p. 39, New York 1998.
- "Determination of Bound and Free-Carrier Nonlinearities in ZnSe, GaAs, CdTe, and ZnTe", A. A. Said, M. Sheik-Bahae, D. J. Hagan, T. H. Wei, J. Wang, J. Young and E. W. Van Stryland, JOSA B, 9, 405-414 (1992).
- "Third and Fifth Order Optical Nonlinearities in Organic Materials", A. A. Said, C. Wamsley, D. J. Hagan, E. W. Van Stryland, B. A. Reinherdt, P. Roderer, and A.G. Dillard, Chem. Phys. Lett., 228, 646-650 (1994).
- "Optimization of Optical Limiting Devices Based on Excited-State Absorption", T. Xia, D. Hagan, A. Dogariu, A. Said and E. Van Stryland, Applied Optics, 36, 4110-4122 (1997).
- "Thermal Nonlinear Refraction in the Dye Solutions: a Study of the Transient Regime", P. Brochard and V. Groilier-Mazza, R. Cabanel, JOSA B, Vol. 14, No. 2, 405-414 (1997) (and references)
- "Simple spectral Method for solving Propagation Problems in Cylindrical Geometry with Fast Fourier Transforms", M. D. Feit, J. A. Fleck, Jr., Optics Letters, Vol. 14, No. 13, 652-654 (1989)
- "Recursive Numerical Solution for Nonlinear wave Propagation In Fibers and Cylindrical Symmetric Systems", S. T. Hendow and S. A. Shakir, Applied Optics, Vol. 25, No. 11, 1759-1764 (1986)
Download the
NLO Sample Database
(Microsoft Access format). Requires a password.

